Due to these updates, you can identify strengths, pinpoint weaknesses, and stay on top of your performance.
It was more than a year ago when we introduced our brand new Dashboard and refreshed Metric Overview. Since then, you were able to see the original Dashboard as well as the new (beta) one, and the same applies to metric overview. Now, we decided to move forward and say goodbye to the old dashboard & metric overview, and embrace the new Nicereply Analytics.
So let’s see how you can analyze your results with a detailed look at the Dashboard and Metric overview.
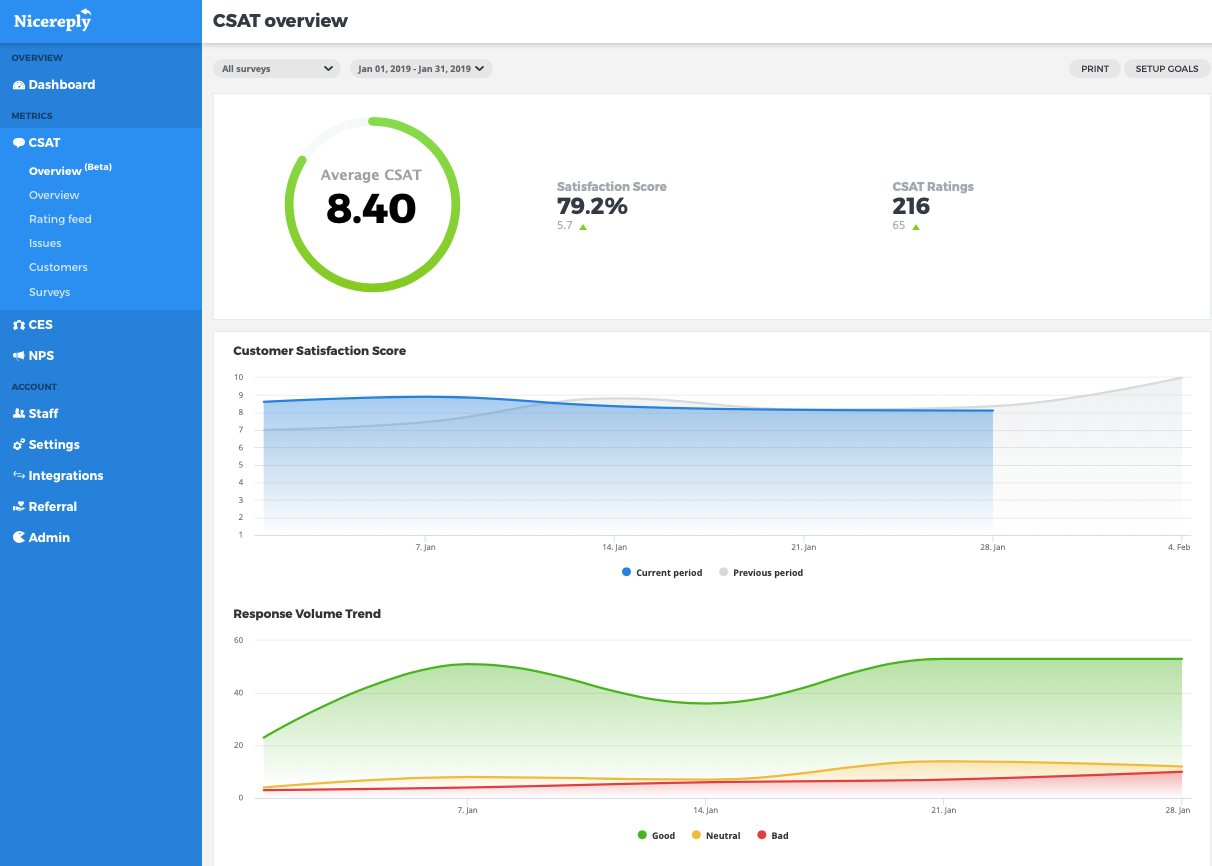
Nicereply Dashboard
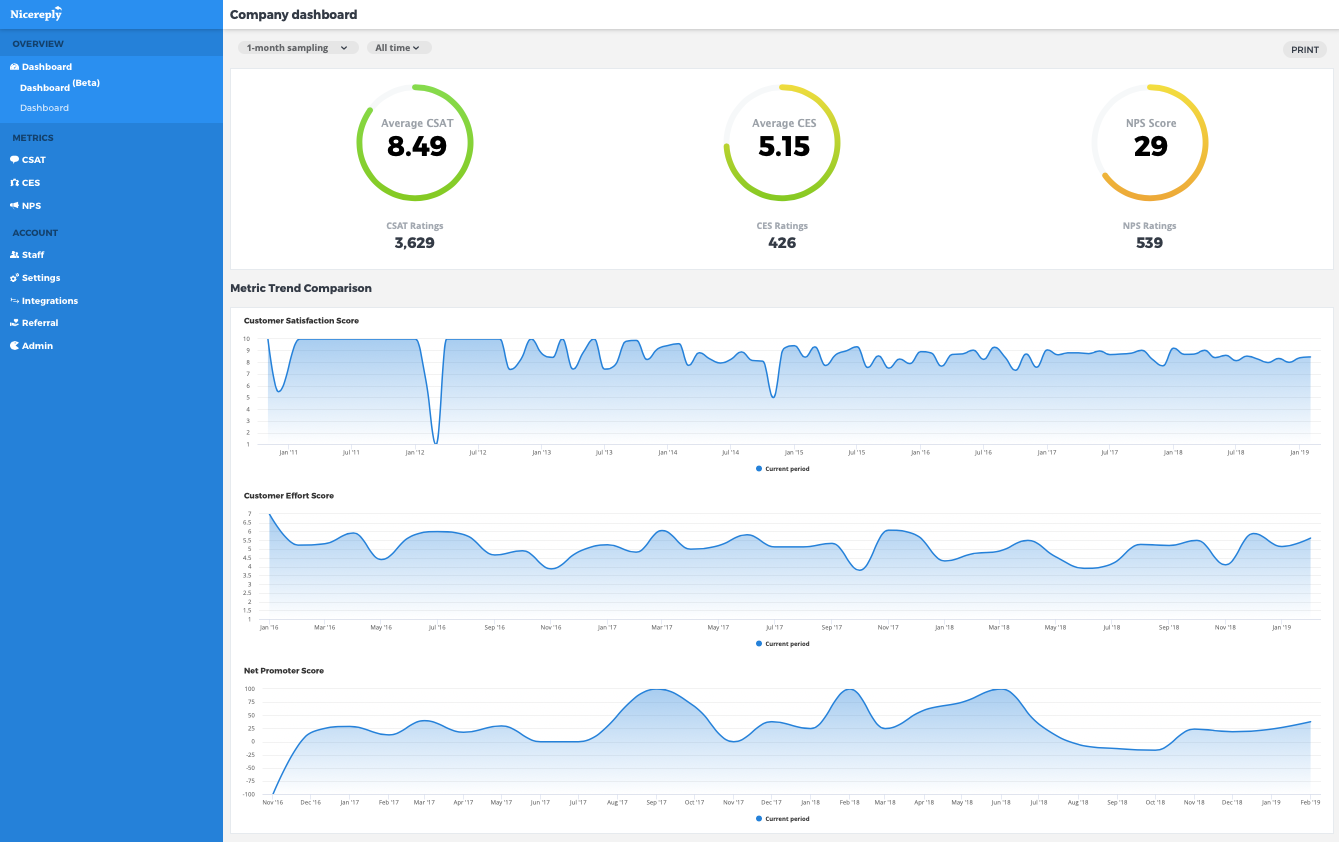
We’ve aligned everything we do around one key mission – providing Customer Support managers with more accurate views of teams, agents and help them better understand their performance.
Nicereply Dashboard includes:
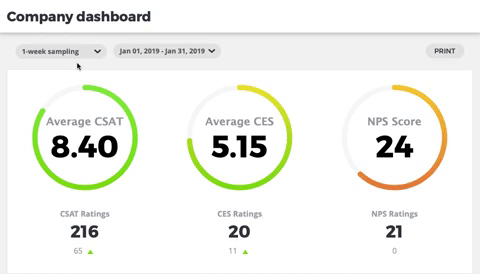
- current rating volume with customizable time filters
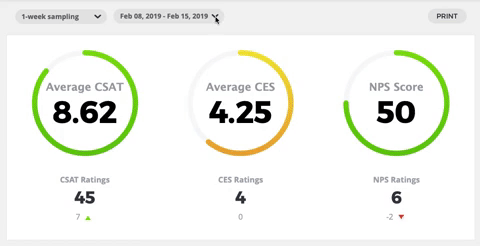
- score dials for all 3 metrics
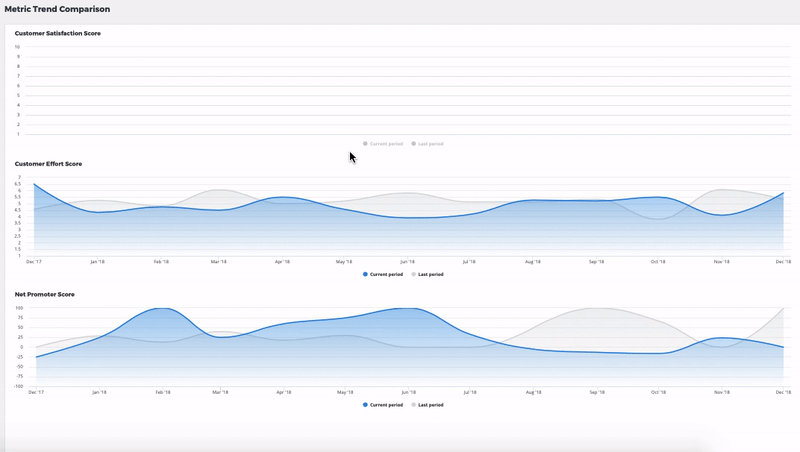
- metrics trend-charts with the previous period for quick comparison
The updated layout of the Dashboard is fully responsive with a better-organized structure for quicker navigation. With new customizable time filters, you won’t miss a thing.
The Dashboard puts CSAT, CES & NPS into one place so you can access them quickly and easily, resulting in a clean workspace.
Nicereply Metric Overview
 Features in Metric Overview:
- Metric Widget
- New Trends and Charts
- Rating Values
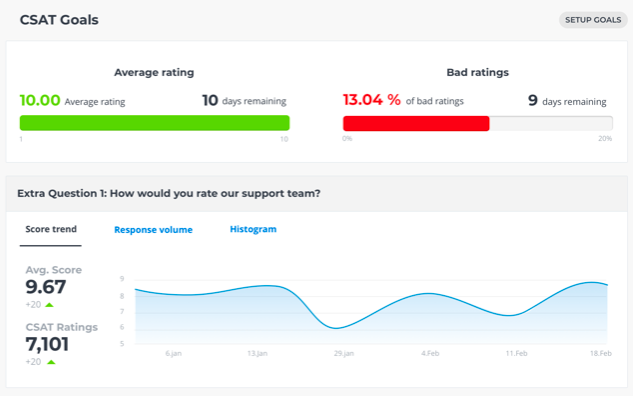
- Goals and Extra Questions
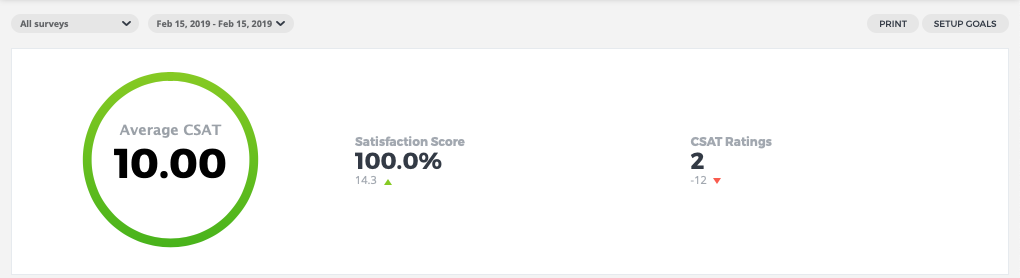
- The updated Metric widget is now personalized for each metric and allows you to get a better overview of your ratings with the possibility of using time filters.
 With improved Metric Overview for each metric, you can select data from more trends and charts like Average Metric Score with the ability to set up the time filter, Response Volume Trend, and a renewed Histogram.
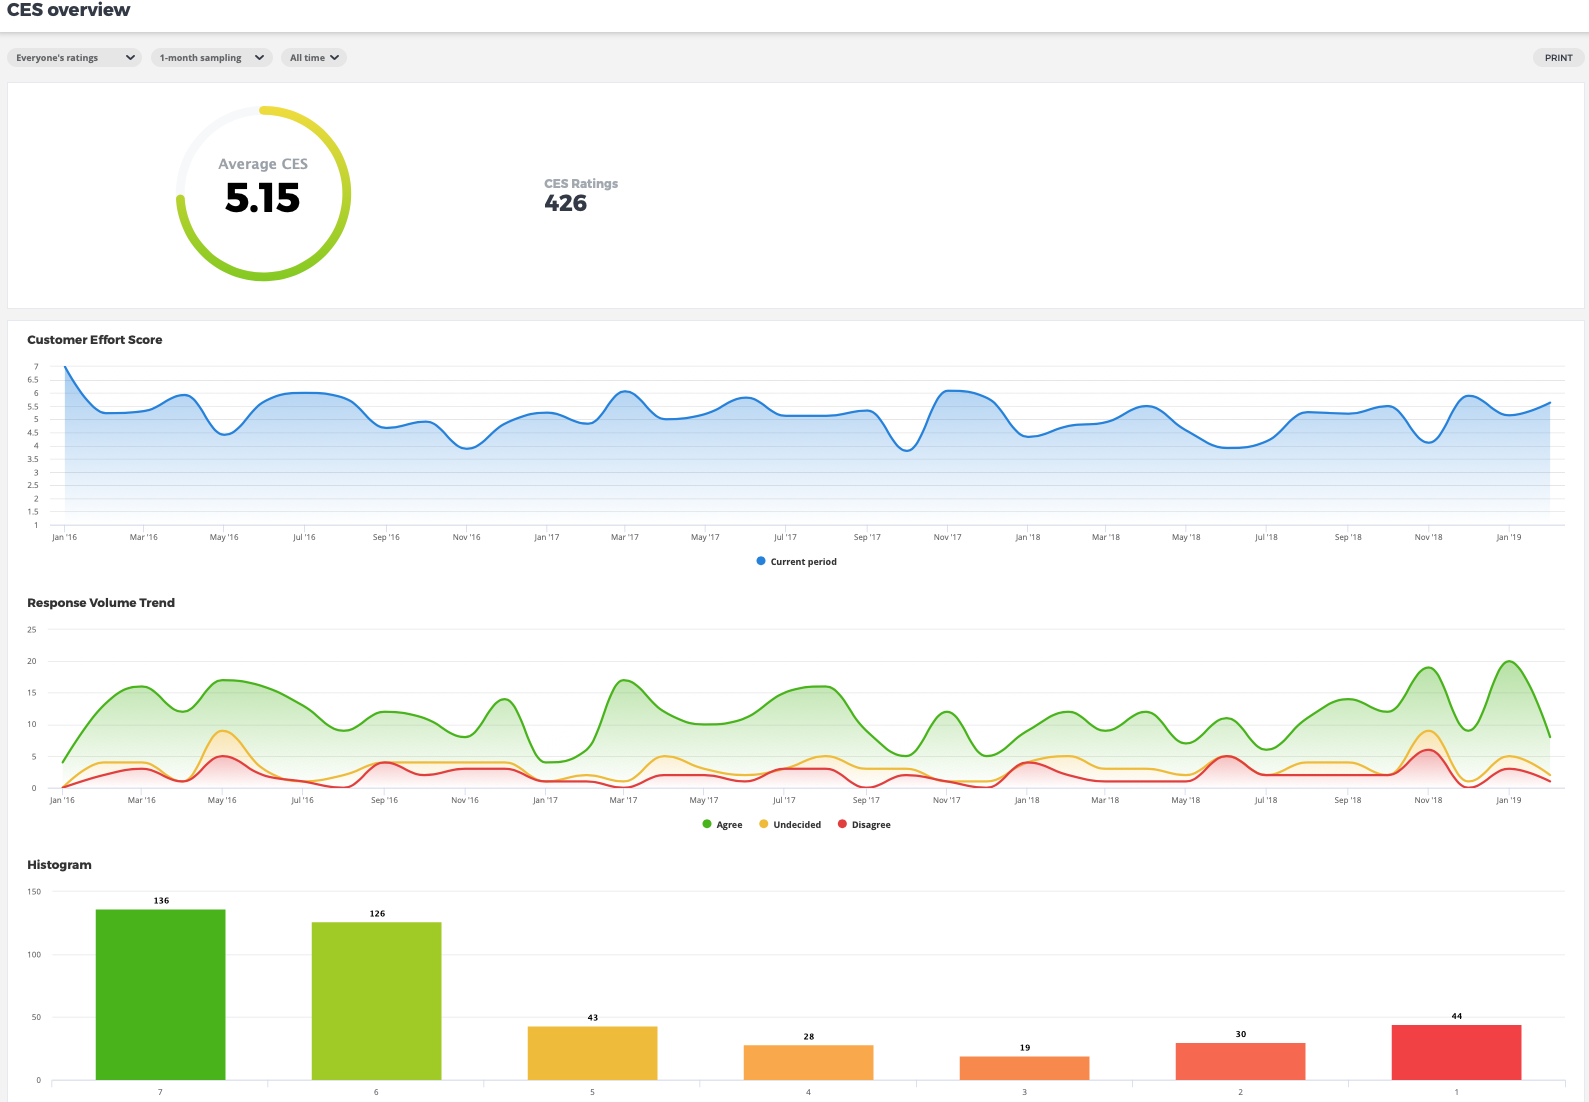 Response Volume Trend now divides ratings into 3 categories, where you can seamlessly add time filter:
- Bad Ratings
- Neutral Ratings
- Good Ratings
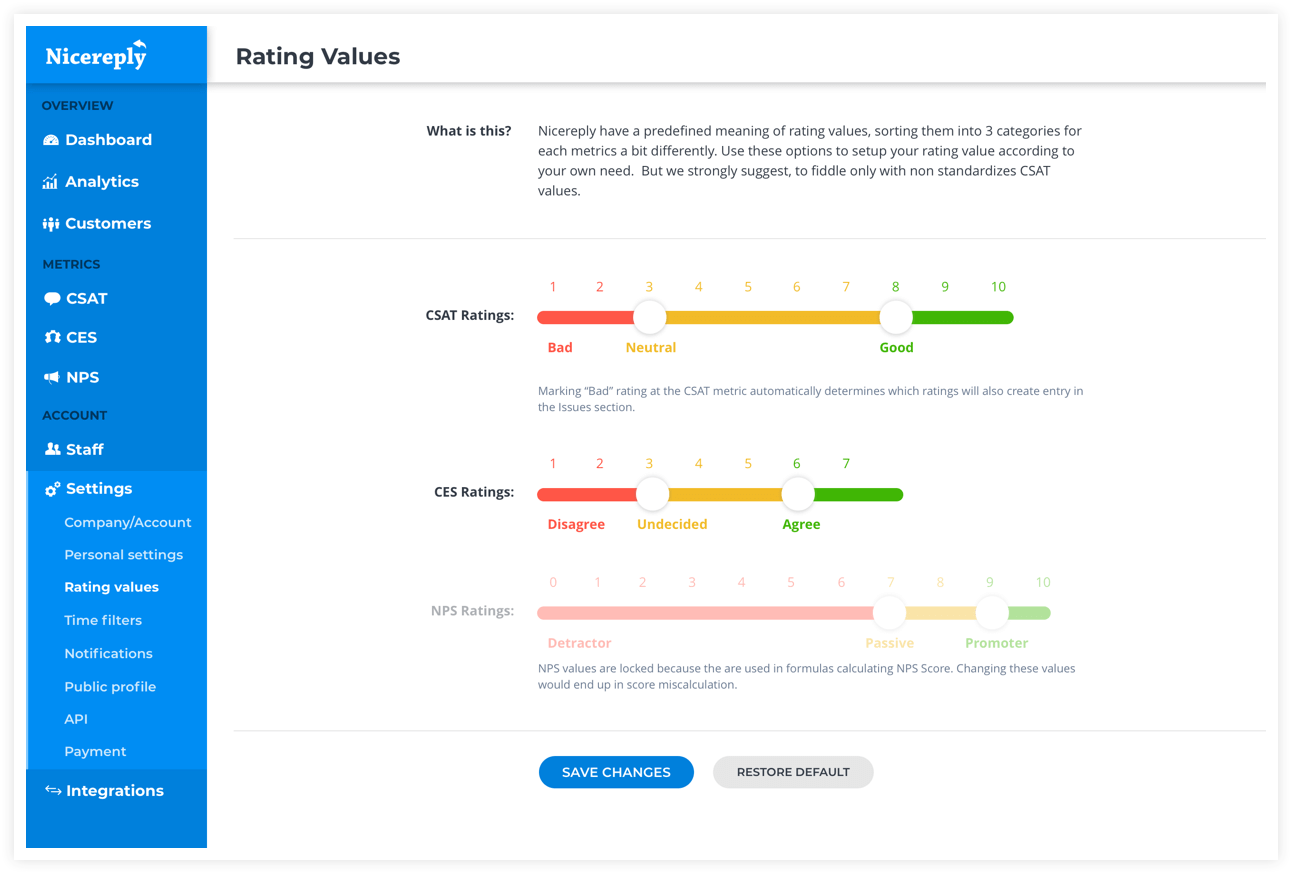 You can now identify which ratings are good, neutral, and bad. You can set your own “standards” for these categories with CSAT and CES. The exception is, of course, the Net Promoter Score, where the methodology divides customers into 3 firmly defined categories of Detractors (0 – 6), Passives (6 – 8), and Promoters (8 – 10).
Looking at individual ratings is useful, but understanding the connections between them is where the real insight comes. Due to these updates, you can identify strengths, pinpoint weaknesses, and stay on top of your performance.
The last update in Metrics Overview is setting up desired goals for CSAT and adding extra questions to your feed. But this time, it’s supplemented by full-fledged overview charts.
Teams and Agents
The one thing that changed with removing the original Analytics is a new CSAT tab called Teams and Agents. Here you can see your agent’s and team’s leaderboards and compare the performance of specific employees or company departments.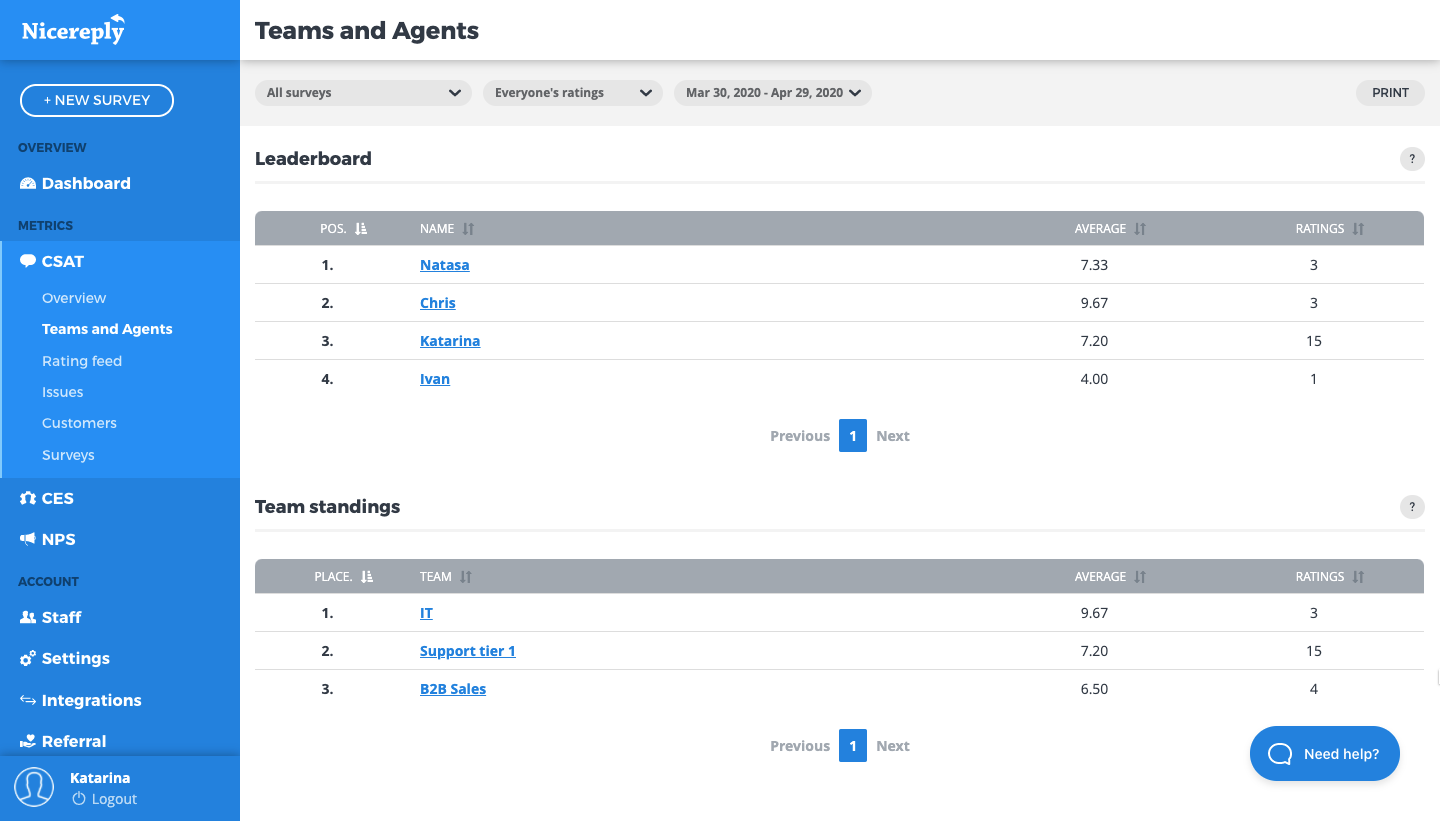
More exciting new features such as team performance analytics are coming soon so make sure to check our blog regularly to be up to date!
How did you like this blog?