We dig into our own data to present a benchmarking customer effort score report for support teams.
There’s a lot of juicy data in Nicereply’s CES reports. If you’ve started measuring Customer Effort Score, you might be wondering how your CES stats stack up against others. By adding more context to the numbers, you can understand just how well your customer support team is doing.
By the end of the post, you’ll know:
- How many other companies are measuring customer effort score
- What a “good” response rate is
- The average CES rating for our customers
- How other companies are using CES to improve customer loyalty.
25% of Nicereply customers are using CES surveys
We know that CES isn’t going away any time soon. In 2018, 1 out of every 4 Nicereply customers are using CES surveys. To drive that point home, here’s a look at our CES adoption rate over the past 4 years.
Adoption Rate (percentage of Nicereply customers that are using CES)
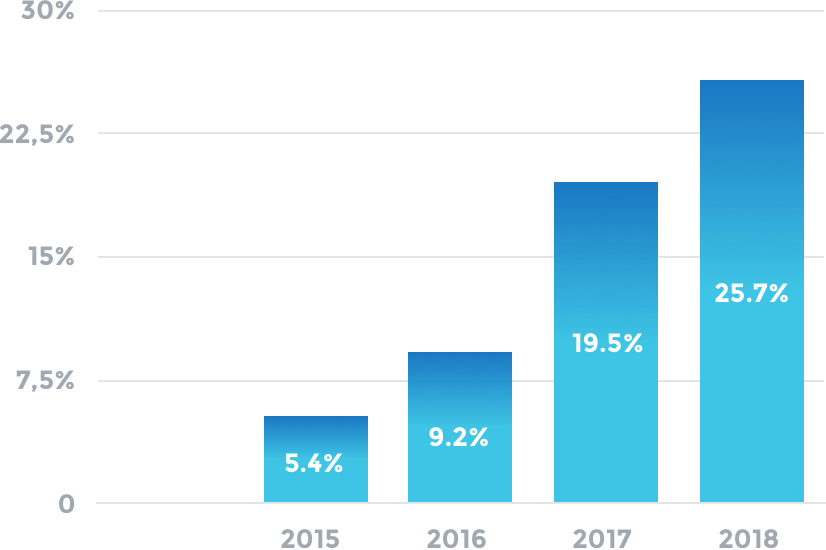
That’s already a 32% increase from 2017 to 2018 – and we’re only half way through the year. For more context, here’s the number of Customer Effort Score ratings our customers have collected over the last three years.
CES Ratings
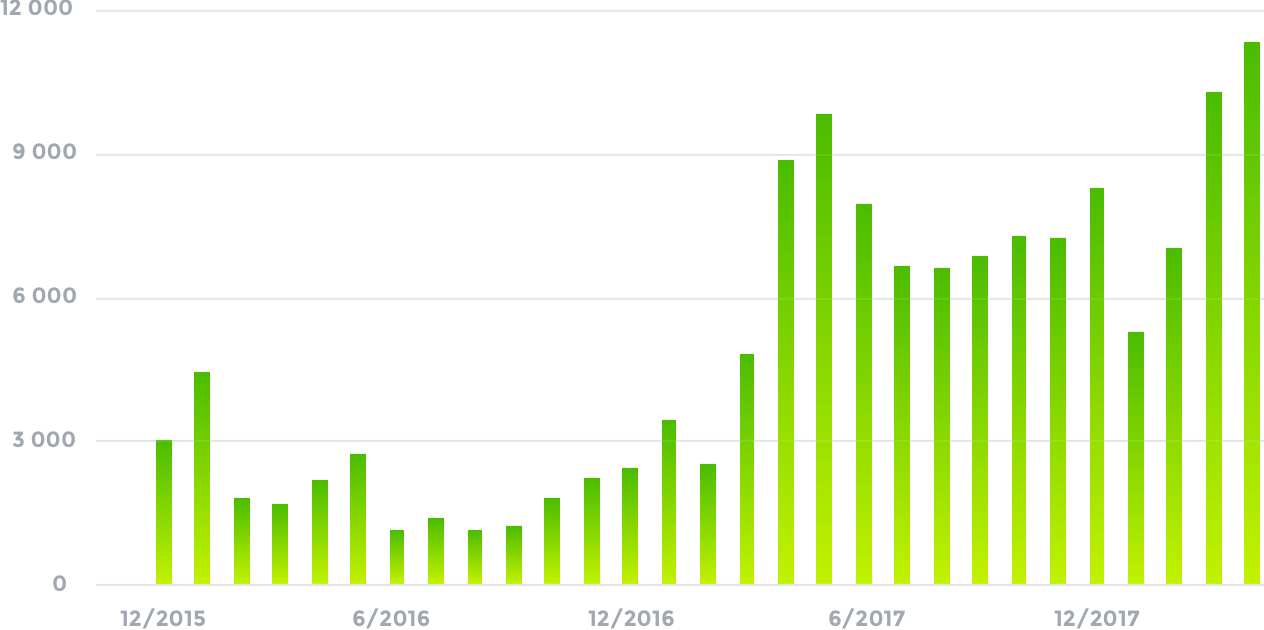
It’s obvious, CES isn’t just a fad that will dissolve into support metrics oblivion in the future. It’s a real thing and there are companies that are experiencing real benefits as a result.
Why we’re anticipating even more CES growth in the future
The benefits? CEB research found that Customer Effort Score is a better predictor of loyalty than the net promoter score. It’s clear, customers want easy help. And don’t we all? But how customer loyalty is defined, can vary from one company to the next. This is where Effort Scores come into play. Your company’s definition of customer loyalty and how that’s achieved can be measured with CES.
Customer loyalty isn’t just about retention and “locking in” customers. The book Effortless Experience puts it this way:
“It’s not just getting them (customers) to stay with you because they have to, but rather because they want to”.
The point is clear. Customers are more likely to commit long-term when you make it easy for them to do so.
Common use cases for CES
If you’ve just started using CES, there are a few ways to get the most of Effort Scores. Here are a few use cases our customers have found helpful
- Directly after a support conversation
- Web survey following a search in your Help Desk
- Survey sent a week or so after an instructional manual is purchased
- Web/Email-based surveys deployed after a website update, gauging any change in ease-of-use
Most of our customers send CES surveys via email after these events have occurred. However, you can also access the CES surveys through the Nicereply API.
Who is CES for?
Customer Effort Score is ideal for businesses that are looking to surface aspects of their support, service, or product that are requiring excessive customer effort. As a result, to understand if you’re getting the most out of CES, you ultimately want to look for:
- Notable improvements in your CES over time (i.e. customers moving closer to a true effortless experience)
- Regular deployments of updates to structure around customer interaction (training, etc.), support documentation/content, volume metrics (i.e. are less people reaching out due to being able to find their answer more proactively, etc.)
- More sentiment indicating a seamless experience with your brand and support
Analyzing CES
With benchmarking customer effort score report, you can analyze CES by taking the average of all responses and by taking the distribution of responses.
The average CES score for Nicereply customers is 5.5.
Over the last 12 months, the average CES has been 5.4. A CES in that ballpark is ideal. And if you can continue to improve that score, your customer loyalty will only improve.
What can do you with this sort of data?
The CEB study found that moving a client from 1 to 5 increases their loyalty (measured in return purchases and reduced churn) by 22%. Increasing from 5 to 7 offers a less dramatic return of 2% increase in loyalty.
This means any scores lower than a 5 needs to be thoroughly investigated for further action
If your scores are in good shape already, then you can expect that your customer loyalty will increase as you strive to make it easier and easier for customers to do business with your company. You can do this by taking a look at your overall distribution.
Overall distribution
Looking at the distribution of ratings allows you to understand how your average is created. Is everyone responding in the middle range? Or are some people finding it really hard, and some people finding it really easy?
Let’s take a closer look into Nicereply’s total distribution of customer effort score ratings:
Distribution of CES Ratings (Nicereply)
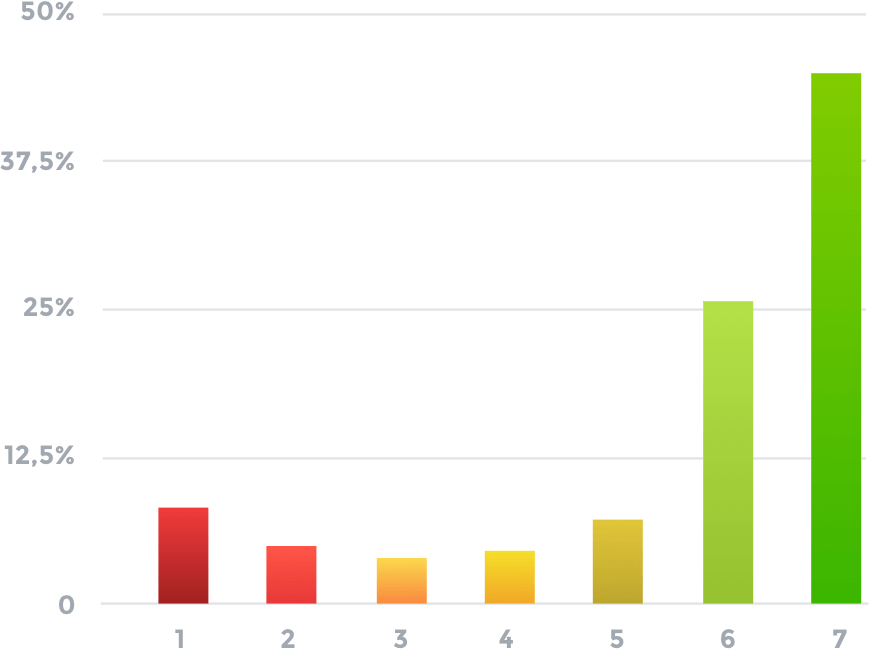
Based on Nicereply’s overall distribution, 44% of customers feel great about the level of effort it takes to resolve their issue; that’s wonderful! (Frankly, we’re not surprised – our customers are wonderful). But there’s always room to improve. There’s still 9% of customers that find it very difficult to get help.
You can learn a lot from happy customers too. Dig into their tickets and investigate what channels, problems, and strategies work well in creating the desired effortless experience. Then, create these experiences with more customers – driving lower effort and customer loyalty.
Working with lower scores
If your total distribution leans toward lower scores, then you’ll want to make a concerted effort to figure out the cause. To start, try to answer questions like these:
- Why is there a subset of customers who cannot easily resolve their question?
- Are they looking to accomplish a similar task?
- Are they contacting you through a particular channel?
- Is there a language barrier that’s causing them to work harder to resolve the problem?
It’s also important to understand that your team’s Customer Effort Score journey is different than every other company’s. Your product might be more complex, or your support issues are more difficult to troubleshoot. If you’re not hitting the 5.5 average, there’s no need to panic. Start by looking at your most difficult conversations and moving those customers up the effort score ladder.
As long as you’re improving slowly, you’ll be driving more customer loyalty.
Remember, the goal of the CES survey is to give a definite first step to improving your customer loyalty. It requires consistent research to understand where customers are feeling friction during their interactions with your product.
If you’re only reviewing the results of your Customer Effort Score every once in a while, it’ll be difficult to get the full picture of where your customers are feeling resistance.
Response Rates
Response rate are based on how many surveys were sent vs. how many customers responded. For example, if you send out 100 surveys and 10 customers respond, your response rate would be 10%.
For the Nicereply customer base, the average response rate for Customer Effort Score surveys is 29.2%.
Let’s look at this in perspective.That means 29.2% of customer who were originally surveyed ultimately responded. Anything between 15 – 25% is a good response rate and gives you plenty of data to dig into. Our customers, on average, are exceeding that.
We think this is because our one-click surveys are incredibly effortless for customers to answer. Instead of having to answer pages of questions, they simply click the button in their email client (on mobile or tablet too) and add a comment if they want.
Sujan Patel, founder of Mailshake, uses CES and NPS together to identify opportunities to increase customer loyalty. Regarding CES, he states: “It’s short and simple, and therefore it’s likely to get a response from customers.”
CES and your peers
It’s always exciting to know what competitors are doing to stay ahead of things. But it’s in the best interest of your company to focus on areas where you anticipate customers might be running into roadblocks with your product.
Deploying CES will help you uncover the areas where the customer experience could be far more effortless, and provide the raw data you need to drive changes to those specific areas.
While comparing yourself to others is addictive, the most important thing is to keep improving your own scores. You do you – and the results will follow.
How did you like this blog?