Thanks to NPS you can truly get a sense of the rising or declining sentiment your customers have about your organization.
Net Promoter Score (NPS) is a flawed, but useful metric. It is crucial to understand the flaws in order to best use NPS to serve your business and how to interpret the results. The problem is primarily due to the calculation, so warning, there will be some math ahead! (Editors note: I know, I shivered too… but keep reading, it’s not so bad)
In this article, we are going to explore the calculation in depth so that you can avoid using the metric in incorrect ways. When used correctly, NPS can add incredible value to your brand, enable your customers to be more successful, and increase your revenue.
Overview of the Calculation
As a brief overview, NPS mainly relies on one question “How likely is it that you would recommend our company/product/service to a friend or colleague?” and is ranked from 0 – 10. NPS is calculated as a difference of percentages. Specifically, it is the difference between the percentage of Promoters (ratings of 9s and 10s) and the percentage of Detractors (ratings of 0 through 6). NOTE: NPS is not a percentage itself.
For example, if 50 people respond to your survey and of those respondents 25 are Promoters, 15 are Detractors, and the remaining 10 are Passives (ratings of 7s and 8s) the NPS would be 20:

NPS can range between -100 (if everyone is a Detractor) and +100 (if everyone is a Promoter).
Why NPS isn’t Perfect
Since Net Promoter Score does not include Passives in the calculation, the meaningfulness and actions of the single value score are sometimes hard to pinpoint. Increases or decreases may mean different things depending on other factors. There are two main flaws that need to be examined.
What actually *is* NPS?
Subtracting percentages is relating them together in a way that isn’t directly intuitive. In literal words, NPS is equivalent to the phrase: For every 100 people surveyed, there are <NPS Score> more Promoters than Detractors. That is an odd way of phrasing a metric.
For example, many surveys are 3 point scales: Agree, Neutral, Disagree. If I ask a group to rate the phrase “Apples are delicious,” it’d be weird to announce the results by saying “for every 100 people I surveyed, 20 more people agree that apples are delicious than disagree.” Because that could mean many actual outcomes from the survey, as seen below:
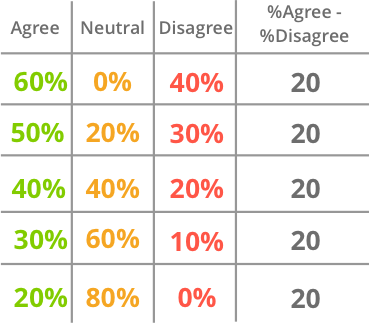
In each of the above cases, the phrase holds true that 20 more people, in every 100 surveyed agreed rather than disagreed. However, as this shows, this could mean anywhere between 20% and 60% of people agreed that apples are delicious and depending on which it is, that may change your conclusions on if people generally think apples are delicious.
We could easily replace the headers in the above chart respectively with Promoters, Passives, Detractors, and NPS Score. The question becomes: Is it better to have 60% Promoters and 40% Detractors or is it better to have 20% Promoters, but no one actively acting as a Detractor? Regardless of the answer, would that change how you work towards improving the result?
What do changes in NPS mean?
Let’s assume a company moves from an NPS of 30 to a 40 from one quarter to the next. Great, right? But, remember we are comparing the difference of percentages. Let’s look at this scenario:
If in a given quarterly survey they have 40% Promoters, 50% Passives, and 10% Detractors:
![]()
If the next quarter that changes to 60% Promoters, 20% Passives, and 20% Detractors:
![]()
This result breaks down as follows:
- NPS increased by 33% (30 to 40)
- Promoters increased by 50% (40% to 60%)
- Detractors doubled (10% to 20%)
So what does that increase in Net Promoter Score represent? While overall the company appears to be doing well, this quarter it has twice as many customers actively identifying as Detractors. An increase in Detractors of that magnitude should be worrisome to any company. Something clearly became worse for a portion of your customers, and that needs to be examined.
Trends in both aspects of NPS are super useful and need to be considered in order to make the right business decisions.
The Effect of Results Distribution
Mathematically, it becomes murkier. Let’s say you have 10 customer responses with scores more-or-less equally distributed: 0,1,2,4,5,6,7,8,9,10. If we were to take an average, we’d get 5.2.

That doesn’t seem too bad. However, in NPS terms that is -40.
![]()
That is not a good score. While you could point out that an average score of 5.2 isn’t that great either, it is easy to argue it is more representative of the ratings’ distribution.
We also can consider an extreme example where you have everyone dislike your product and services and rate all 0’s. Your NPS would be at -100.
![]()
That score clearly indicates you need to improve your product and service. Based on this, you could spend months or quarters working on your customer experience, fixing defects, listening to your customers more, rebranding your company, etc.
Once all done, you survey your customers again and even if every single customer moves to a rating of 6, which is a significant improvement from 0, they are all still considered Detractors. Your NPS stays at -100, as if you had done nothing at all. This example demonstrates why distribution has a real impact on NPS.
Using NPS effectively
The last section may sound negative, but it definitely isn’t! NPS is a very powerful metric when used correctly and in conjunction with other meaningful data. How do we ensure we use NPS effectively?
NPS is not a Single Number
NPS should not be seen as a single number metric. Trending NPS is useful for understanding an overall direction for your company’s reputation. However, action-wise you need to do more research.
Watch for the proportions of Promoters and Detractors and how they grow and shrink over time as well. If you see a big jump in Detractors, try to understand the general sentiment of those customers and work towards investmenting in their concerns. Equally, if something you are doing resonates well leading to a jump in Promoters, continue to do those positive things.
Segmenting NPS by customer type, plan type or cohort (when they joined) can also illuminate trends that need attention. If free customers are super happy – but paying customers are all detractors – you have a lot of work to do.
Read the Sentiment
We need to make sure we don’t miss the underlying metadata and sentiment that comes with it. Otherwise, we may focus on the wrong areas to improve, or worse stop improving at all. Shep Hyken says it best: “Two of my favorite questions to follow the standard one-to-10 survey are to ask, “Why?,” and if the number is lower than a 10, “What would it take to raise our score just by one point?” … That is important feedback that any company can use.”
NPS should be used in conjunction with written feedback, or free-form questions that allow you to understand why the rating was made. This feedback will help direct your programs and the changes needed to improve your product and service, as well as your NPS.
Driving Behaviour
Using NPS directly is not great for goals or as a reward such as variable compensation plans. Goals and compensation plans should focus on driving positive behaviors, but NPS doesn’t immediately reflect positive behaviors, as we saw in the above example of all the work you could do to maintain a -100 rating.
Goaling on tangible outcomes, such as higher retention rates, positive customer outcomes, and customer ROI are more tangible goals to set, and all will positively impact your NPS.
NPS is not alone
In conjunction with Net Promoter Score, measure Customer Effort Score (CES) and Customer Satisfaction (CSAT). Together these will give you a great view of the behaviors you want to drive. CES is a measure of how easy a customer’s experience was with your services. It has been shown to trend very closely with NPS. If it isn’t, that can give you valuable information about the changes you need to implement.
For example, if you see NPS trending down, but CES going up, that may be a sign that your support/service is doing well, but there is a problem with your product or sales cycle.
CSAT is a measure of the customer satisfaction, typically in the context of a single interaction such as a closed support ticket, or satisfaction with an implementation. Since CSAT is generally a more frequent measure, you can watch a trend in its value and start to predict how that might impact NPS and enact measures to correct it faster.
Why NPS is still useful
NPS is a measure that encompasses so much into a single value. You can truly get a sense of the rising or declining sentiment your customers have about your organization. You can use it as a benchmark against competitors or industries and strive to improve the way your company is perceived. Management consultant Peter Drucker famously said: “The purpose of a business is to create a customer.”
I like to extend that to: The purpose of creating a customer is so they help you create another customer. Consistent and meaningful analysis of Net Promoter Score can help your promoters do just that.
Read: 5 Benefits of NPS Program that You Might be Missing Out On
How did you like this blog?