Find out what is a good Net Promoter Score & get out the most of your surveys!
It can be really hard to discern how your customers truly feel about your company, product, or service.
This gray area is a pain point for all businesses and leaves them without a clear path to improving offerings and meeting customers’ needs.
Fortunately, your Net Promoter Score (NPS) is a solid metric to combat the gray area, and understanding it will give you strong insights into your customers’ perception of your business.
This article will discuss a good NPS score in 2025 and how you can measure your NPS.
- What is a NPS Score?
- What is a Good NPS Score?
- What is a Good NPS Score by Industry?
- Benchmarking your Net Promoter Score
- What is a Good NPS Score for SaaS?
- What is a Good NPS Score for an Event?
- Which NPS Method Should You Use?
- How to Calculate NPS in Three Steps
- Analyzing your NPS and Identifying Areas for Improvement
- Channels to Deliver NPS Surveys
- Employee Net Promoter Score (eNPS)
What is a NPS Score?
A NPS score is a market research metric that measures customer loyalty, satisfaction, and the likeability of a company’s performance.
What is a Good NPS Score?
Bain & Company says a good net promoter score is anything above 0.
20+ is considered great, and 50+ is fantastic. Anything above 80 is considered prestigious due to the difficulty of achieving such a score in a competitive market.
However, it’s important to note that industry standards for NPS scores may vary and that benchmarking your score can serve as a good Northstar to reference.

What is a Good NPS Score by Industry?
Average NPS by Industry
The following infographic is provided by SatMetrix, the creator and owner of the NPS trademark. The infographic shown is the U.S. Consumer 2023 Net Promoter Benchmarks.

NPS Leaders by Industry
The following infographic is provided by SatMetrix, the creator and owner of the NPS trademark. The infographic shown is the U.S. Consumer 2023 Net Promoter Benchmarks.

Benchmarking your Net Promoter Score
As you can see, the average net promoter score for industries varies quite significantly. Most industries have an NPS above 0. According to Bain & Company’s scale, this should mean their NPS is considered good.
By definitive measures, yes. But theoretically speaking, no.
Using your industry average, compare your NPS score with other companies in the same industry. This method is known as relative NPS and will serve as a benchmark for your net promoter score.
Measuring NPS scores by company provides a more contextual view, showing where your company stands relative to direct competitors. The relative NPS score helps to benchmark your customer loyalty against others in your market, which could highlight competitive advantages or areas needing improvement.
Counterwise, the absolute NPS method is more applicable to benchmark your net promoter score among companies across all industries. This method compares your company’s NPS score against a general, agreed-upon standard or ‘good score.’
A significant drawback of this method is that it doesn’t consider the specific nuances or averages within your industry. The absolute NPS score could be seen as a standalone measure of customer loyalty, irrespective of competition.
What is a Good NPS Score for SaaS?
According to the U.S. Consumer 2023 Net Promoter Benchmarks, the average NPS score for software & apps is 27. And TurboTax is the leader with a solid 40 for their NPS score.
That being said, it can be concluded that:
NPS Score Range 0-10 = Not good
NPS Score Range 0-20 = Okay
NPS Score Range 21-30 = GoodNPS Score Range 31+ = Fantastic
What is a Good NPS Score for an Event?
There are no definitive guidelines when assessing NPS scores for events – determining a good score can be challenging.
An event isn’t normally viewed as a “product” therefore, it is not as easy to compare against a benchmark.
But having a clear understanding of customer feedback and expectations can be beneficial in creating a successful event.
To establish a good score, event organizers must consider feedback from multiple sources, including a question from each attendee and reviews on social media platforms.
For your question, simply ask, “How likely are you to recommend this event to others?”.
Using this data, event organizers can gain insight into what aspects of their event resonated with attendees and how they can improve for future events.
Additionally, understanding the needs and wants of their target audience is important because it helps organizers create an experience that caters to their preferences.

Which NPS Method Should You Use?
The absolute NPS method might be more beneficial for internal performance tracking and understanding how well you’re doing regarding customer loyalty.
Meanwhile, the relative NPS method would give you a competitive perspective, helping you to know how well you’re doing compared to other companies in your industry.
Both methods, used together, can give you a comprehensive view of your company’s performance in terms of customer satisfaction and loyalty.
How to Calculate NPS in Three Steps
Calculating your Net Promoter Score (NPS) is a simple yet powerful way to gauge customer loyalty. The process is straightforward and provides actionable insights and a reliable performance metric.
By determining your NPS, you gain a window into your customers’ experiences, allowing you to pinpoint areas for improvement and celebrate successes.
With its ease and effectiveness, NPS calculation is a tool you must pay attention to when pursuing business growth and customer satisfaction.
Follow these three steps to get started:
- Ask the golden question.
- Segment your customers.
- Calculate your NPS core.

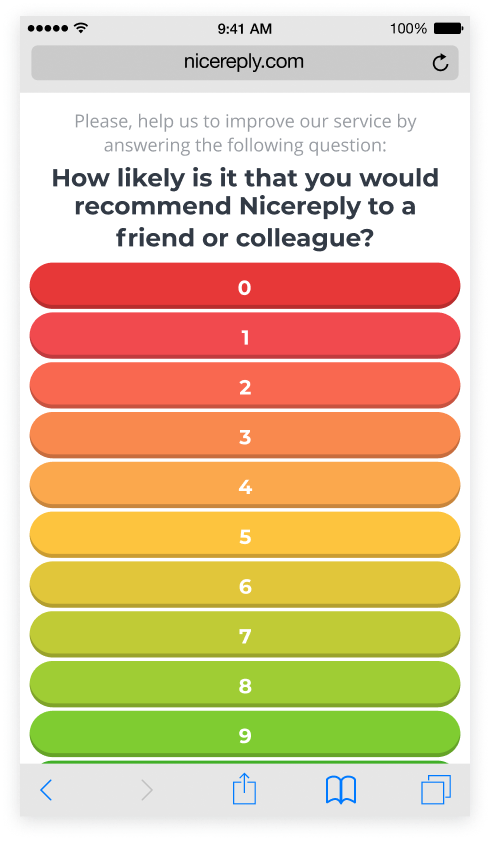
Ask the golden question:
o calculate NPS, you need to use a customer survey tool and ask your customers a single question: “How likely are you to recommend our company/product/service to a friend or colleague?”
They will respond by selecting a number from the rating scale from 1-10.
Simple? Yes. Effective? Very!
You are calculating a metric that will help you better understand the following benefits:
- Customer loyalty
- Customer satisfaction
- Customer pain points
Segment your customers
Having a data set of customer metrics is great, but what do you do with that information? Customers are segmented into three groups: Promoters, Passives, and Detractors.
- Promoters (9-10 ratings): Customers who will likely recommend your company/product/service Promoters contribute to increased profitability by maintaining long-term customer relationships and are more inclined to endorse your business. They provide valuable assets through testimonials, reviews, and potential future recommendations.
- Passives (7-8 ratings): Customers are neither likely nor unlikely to recommend your company/product/service. Passives exhibit a neutral stance. Their experience isn’t positive nor negative, resulting in an “I don’t really care” feeling toward your business.
- Detractors (0-6 ratings): Customers are unlikely to recommend your company/product/service. Detractors are individuals who’ve primarily had negative experiences with your company. If not addressed properly, these customers may discontinue their relationship with your business, leave bad reviews, and spread damaging word-of-mouth.
Start your day
with great
quality
content
Calculate your NPS score
Finally, the NPS score can be determined by taking the difference between the percentage of detractors and the percentage of promoters.
For example, let’s say your data set consists of 100 customers. If you have 80% promoters, 5% passives, and 15% detractors, your NPS score would be 65.
A high NPS score indicates that your customers are very satisfied with your company/product/service and are likely to recommend it to others.
A low NPS score suggests that your customers are unsatisfied and are unlikely to recommend it to others.
Analyzing your NPS and Identifying Areas for Improvement
Once you have your NPS score, it’s time to analyze it to understand what drives your customers’ satisfaction and identify areas for improvement. This will help you keep your customers happy and loyal and, ultimately, grow your business.
Here are eight tips for analyzing your NPS and identifying areas for improvement.
Segment your data
Once you have your NPS score, you can break it down by customer segment, product, region, or channel to see how different groups of customers are feeling about your company. The goal is to gain a good understanding of your customer feedback. This can help you identify areas where your customers are particularly happy or unhappy and focus your efforts on improving those areas.
If your NPS score is low for a particular product, you should investigate why. Is there something wrong with the product? Is the marketing for the product not reaching the right people? Take time to understand the issue and develop the steps to fix it.
Look at the open-ended comments
Your customers’ comments can provide valuable insights into why they gave you the score they did. Look for common themes in the comments to identify areas to improve.
For example, if many customers have trouble understanding your product’s instructions, you may need to clarify those instructions. Or, if many customers say that they were not satisfied with the customer service they received, you may need to improve your customer service training.
Paying attention to all your customer’s comments and addressing their concerns will provide the leverage you need to identify areas of improvement for a better customer experience.
Compare your NPS score to industry benchmarks
As previously discussed, the relative or absolute NPS method will gauge your performance among average net promoter scores.
You can compare your sales, marketing, and customer service data to your competitors’ data to see where you stand. You can also look at your competitors’ websites and social media pages to see what they are doing well and what you could do better. Or you can ask your customers what they think of your competitors to understand their preferences better.
Focus on the drivers of satisfaction and prioritize your efforts
Not all areas for improvement are created equal. Some will have a bigger impact on your customer satisfaction than others, and it’s important to prioritize the ones that move the needle.
Look at the data you gathered from your NPS survey to identify the most critical factors to your customers; these are the areas where you should focus your improvement efforts.
Double down on successful drivers and eliminate the unsuccessful ones.
Make changes that are easy to implement
Don’t try to do too much at once. Start with small, simple changes that you can make quickly to help build that initial momentum. Doing so will make success more likely in converting unhappy customers into happy customers.
Measure your results
Once changes have been made, track the results to see if they’ve had the desired impact. Improving customer satisfaction is ongoing, and measuring your efforts to improve a positive customer experience is crucial. The only way to see if your efforts are working is if you track your NPS score over a period of time. Establishing a quarterly, semi-annual, or yearly audit is a good place to start.
Channels to Deliver NPS Surveys
There are several reasons why delivering NPS surveys via different channels is effective. Common reasons include increased response rates, improved data quality, and more actionable insights.
- Increased response rates: Using multiple channels increases the chances that your customers will see and respond to your survey.
- Improved data quality: Collecting feedback from various sources can give you a more accurate picture of your customer satisfaction.
- More actionable insights: Tracking NPS scores over time and across different channels allows your company to identify trends and patterns that will help improve the business.
Whether the delivery time or frequency, each channel method has unique characteristics.
Email is by far the most popular channel for customer interactions because it is easy to use and has a high return on investment. Email marketing tools and software can automate sending customer surveys, saving time and money. However, like most things, email marketing has some drawbacks, such as low response rates and a lack of personalization.
In-app
Unlike email surveys, in-app surveys tend to have a higher response rate. This is likely because users who are browsing your website or mobile app already have an interest in your company/product/service.
Phone
Companies tend to be big fans of phone surveys. Phone surveys tend to have a high response rate because a live representative directs the conversation between them and the customer. The representative can create an engaging conversation, be more personable, and address questions or concerns.
Text Message (SMS)
The average open rate for text message marketing campaigns is 98%, compared to 20% for email marketing campaigns. With an open rate of nearly 100%, you can almost guarantee your customers will see your surveys. However, converting them to survey completers is another challenge.
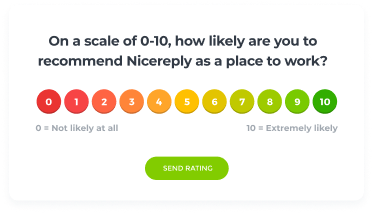
Employee Net Promoter Score (eNPS)
Measuring customer loyalty and satisfaction is a great way to understand your customers. But what about the people who work for your business? The ones who take care of your customers?
Companies can also measure loyalty and satisfaction with employee Net Promoter Score (eNPS to get a pulse within their organization.
There are many benefits to measuring eNPS:
- Improved employee engagement and satisfaction
- Reduced employee turnover
- Increased productivity and innovation
- Improved customer satisfaction
- Increased brand loyalty
eNPS helps you assess employee engagement and the likelihood of your employees recommending your company as a workplace. eNPS is typically part of a larger employee engagement survey that allows you to identify areas for improvement based on engagement levels. Tracking changes in your eNPS score and analyzing employee feedback will help you increase employee engagement and foster an overall positive work environment.
The best way to learn is to try. Get your free trial now and unlock the potential of feedback surveys.
How did you like this blog?