Imagine you are sending Customer Effort Score survey to your help desk customers every time a ticket is resolved and Net Promoter Score campaign to measure customer loyalty every second month.
You analyse collected feedback on a regular basis but you’re left wondering how many customers open and respond to your survey emails. Now you can find this information directly within your metric overview.
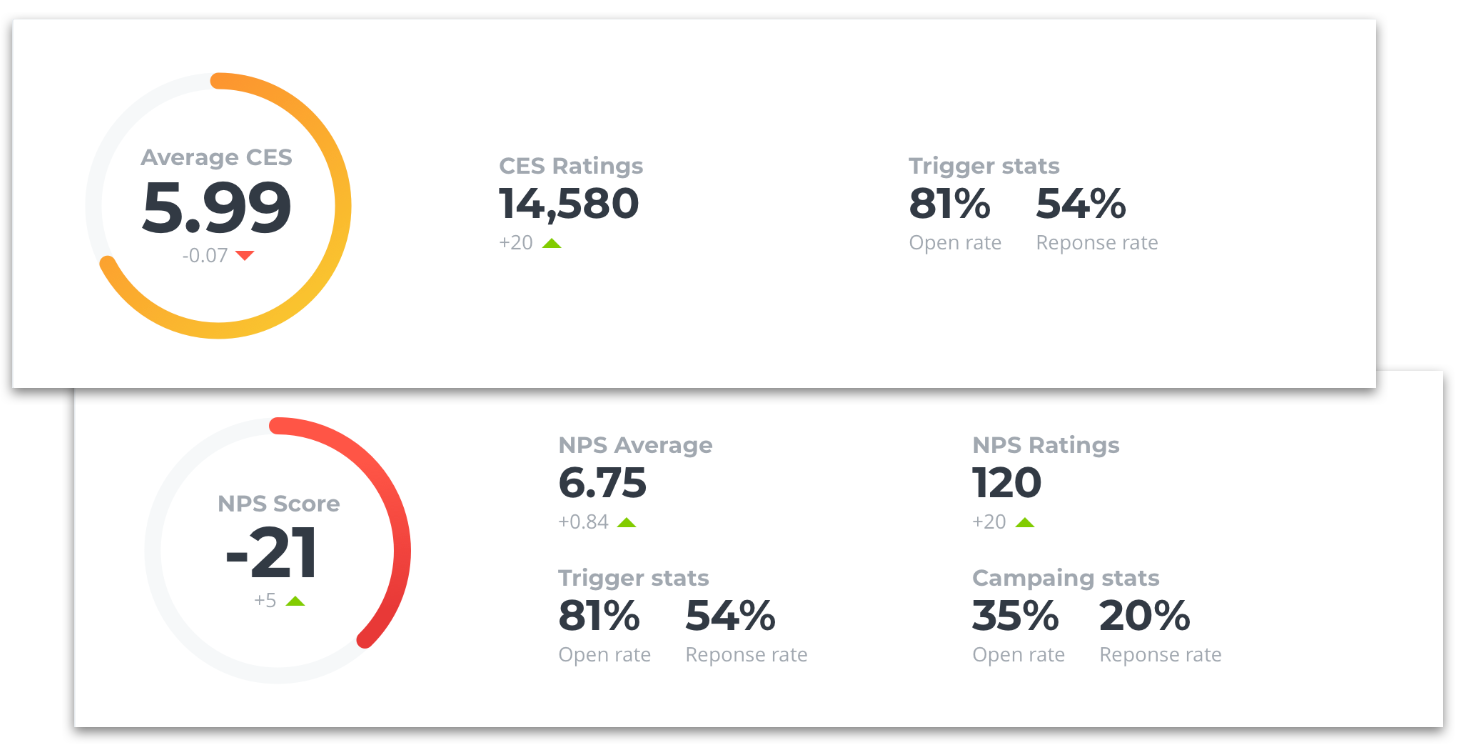
Our new Analytics feature – Trigger Stats & Campaign stats allows you to analyse open and response rates of your active triggers and campaigns.
You can see your open rate & response rate stats for different time periods as well as compare different surveys. For example if you are using multiple triggers or campaigns for different customer groups or company departments.
More Analytics updates such as team performance analytics are coming soon so make sure to check our blog regularly to be up to date!