You’ve read all the reasons why you should be measuring Customer Effort. Your CSAT score is hovering close to perfect, and you’re not getting enough actionable customer feedback from your surveys. It’s time to take the leap and set up your first customer effort score survey. Don’t worry! You can always try it out for a month and then change back to CSAT if you’re not seeing actionable results. You are not bound to one customer support metric for life.
![]()

Ready to jump in? Let’s go.
CES is usually measured transactionally. This means asking for customer feedback after each customer service conversation ends. To start measuring customer effort score, you’ll need to create a customer effort score survey, send the survey and then read the results. We’ll walk you through each of these steps below.


Creating a Customer Effort Score Survey
If you’re measuring CES, there’s one question to ask.
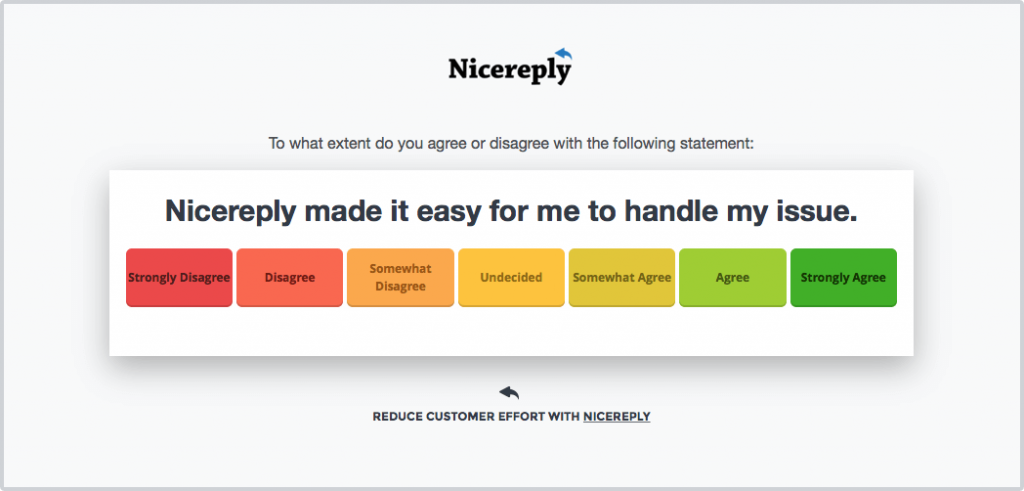
To what extent do you agree or disagree with the following statement:
[Company A] made it easy to resolve my issue.
Customers respond on a 7 point scale from 1 (strongly disagree) to 7 (strongly agree). The customer effort score survey designed by Nicereply is also color coded from red (unhappy) to green (happy) to make it even easier for customers to read the survey.

Follow up Question
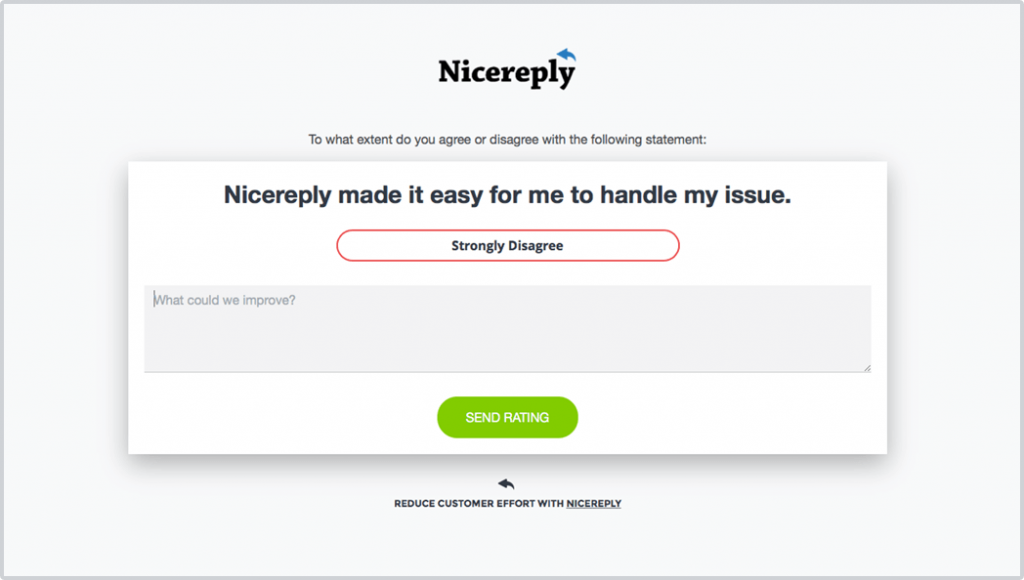

While the score is important, the reason behind it is perhaps even more so. Nicereply automatically asks customers what your company could do to improve the score in the future.
This response is pushed to your Help Desk ticket so you can dive in and investigate the reason your customers gave the score they did.

Sending your Customer Effort Score survey
When you set up an integration between Nicereply and your help desk, you’ll be able to customize the automation that sends your survey. Depending on which help desk you use, you’ll have different options on how much you can customize your sending triggers.
Subject line
First things first, you want your customers to open the email. That’s the first step in getting a high response rate. Your customer probably assumes the issue is resolved, so you need to catch their attention.
Definitely follow all the best practices for email subject lines.
- Stick to 65 characters or less. Any more and your subject will be cut off.
- Add personalization! Humans love the sound of their own name more than anything.
- Be creative. Emojis and the unexpected help boost those open rates.
Specifically for customer service surveys you want to be familiar and recognizable, but also indicate that you need more action on their part. If you can, refer to the original conversation and ask a question.
A few great examples:
- How’d we do? Re: {ticket subject}
- Let us know how we did on ticket #1234!
- We’d love your feedback on your last conversation
- {Name}, did we make your day?
Finally, don’t set it and forget it. Try a couple different variations and test to see which gives you the best survey response rate.
Timing
CES is unlike CSAT in that it’s dependent on issue resolution. You can’t ask it with every reply – you need to wait until the end of the conversation to ask about the total overall effort.
With that in mind, you should set your automation to send the survey question out after the ticket, case or conversation is set to a resolved status. You have two options:
- Immediately after resolution: You can set your customer effort score survey to send as soon as the ticket is marked resolved. This makes sure customers don’t forget about the experience. But it also means that the issue might not have been entirely resolved yet. If a ticket has closed by an automation – and not because a customer has said they are satisfied – you might see a few more poor ratings or reopened tickets
- 24 hours after resolution: Sending the survey a day after the ticket is closed means that customers have more time to reopen the ticket or confirm that everything is working. It also prevents customers from receiving too many emails in a row and perhaps ignoring the survey.
When looking at all the customer service surveys collected last year, we found that the best responses came on Wednesday afternoons, and the highest response rate was at 9am. You might want to take into account time of day when sending surveys!
From Address
What email address or name do you send your survey from? You can either use an anonymous email (like support@yourcompany.com) or a more personalized one. Maybe you want to send it as an alias email from your CEO.
The biggest thing to avoid is using a no reply email address. Nothing says “we don’t actually want your customer feedback” more than using an email address that you can’t reply to. Plus, if users who aren’t as comfortable with technology reply to the survey by mistake, you’ll miss their reply!
Encourage replies and customer feedback through any channel – make sure you avoid sending customer service surveys from a no-reply email address!

Next Steps
Once you’ve started sending surveys out, you’ll start getting responses back. Building a process to read, analyze and use the scores to improve is just as important as sending the survey in the first place.
Interpreting Customer Effort Scores
CES is a special metric because we look at the average score, as well as the distribution.
Average – simply take all of the responses you’ve received, add them up and divide by the number of total responses. Nicereply does this for you automatically at the top of your report
Distribution – possibly more important than the overall average is the distribution of scores you receive. Think of this way: Your average CES registers in at 5 this month. Not bad, right? But, when you start digging deeper, you find while most customers are giving you nice high scores, there’s a pool of customers who give your team a 1 dragging down that average. Maybe they’ve all experienced the same glitch in your billing system; if you hadn’t looked at the distribution, you would have missed it!
Read our post for more on what all these customer effort scores actually mean.
Improve customer loyalty using CES
Moving a customer from a 1 to a 5 in their response is shown to improve loyalty by 22%. In this case, loyalty means likelihood to recommend, repurchase and continue doing business with you in the future.
To improve CES, find out what drives customers responses. See what similarities there are between high effort experiences. Maybe it’s a part of the product that keeps frustrating users. Maybe it’s a specific support request that is difficult to deal with.
Decide which effort-inducing problem you’re going to tackle first. Track the effect it has on CES to see if you’re making it easier for customers to do business with you!
Read our step by step guide to analyzing CES survey results.
Have questions about using CES? Our support team is keen to assist. Send us a message and let us know your questions. We’re here to help! 🙂