Customer satisfaction can be a tricky thing. Apart from the service or product itself, there can be many factors influencing the ratings you’re getting.
How do customers act and what affects their behaviour?
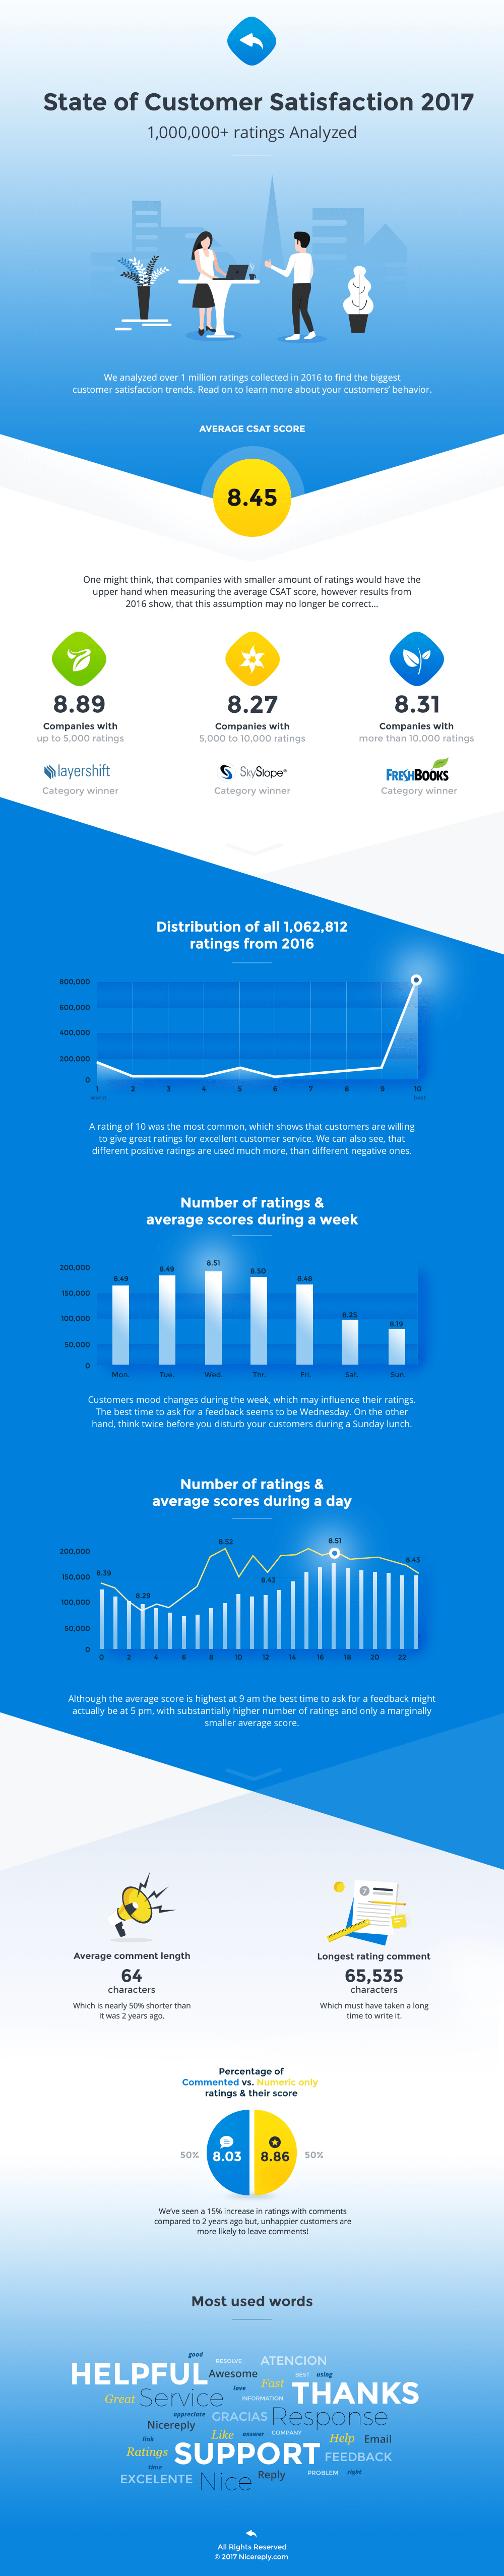
Are you sending your customer satisfaction surveys at the right time? Are your customers more inclined to give you a good rating during specific days? Should you collect additional information in as comments? Does any of this even make a difference, or are customers just more likely to give you a bad rating anyway?
Over the course of 2016 we’ve collected more than 1 million customer ratings. Furthermore we’ve analysed these data to award the best and brightest of the support teams using Nicereply in our Customer Happiness Awards 2016.
Make sure not to miss the latest Customer Happiness Awards 2018!
Today we answer these questions and bring you some valuable information about customer behaviour. Browse the most interesting ones in the infographics here and benchmark your customer service team.
How did you like this blog?


